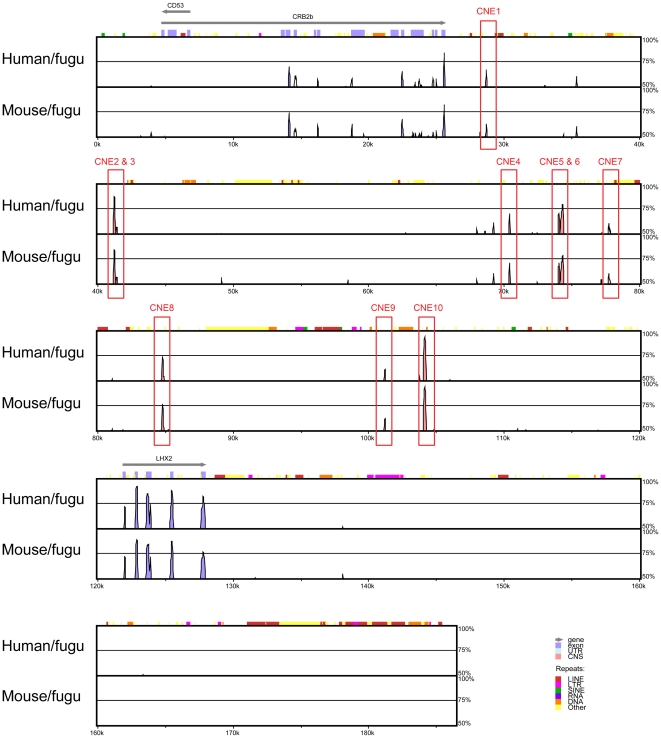
Figure 4. CNEs in the Lhx2 locus.
Human, mouse and fugu Lhx2 loci were aligned using MLAGAN and CNEs (≥65% identity over 50 bp) were predicted with VISTA. Fugu served as the base sequence. Pink peaks denote CNEs while blue peaks denote conserved coding sequences. The arrows above the blue boxes that denote exons indicate the direction of transcription. x-axis represents distance along the fugu sequence while y-axis shows the percentage identity in each pairwise alignment. The pink peaks that are not annotated do not meet the thresholds of ≥65% identity over 50 bp.

