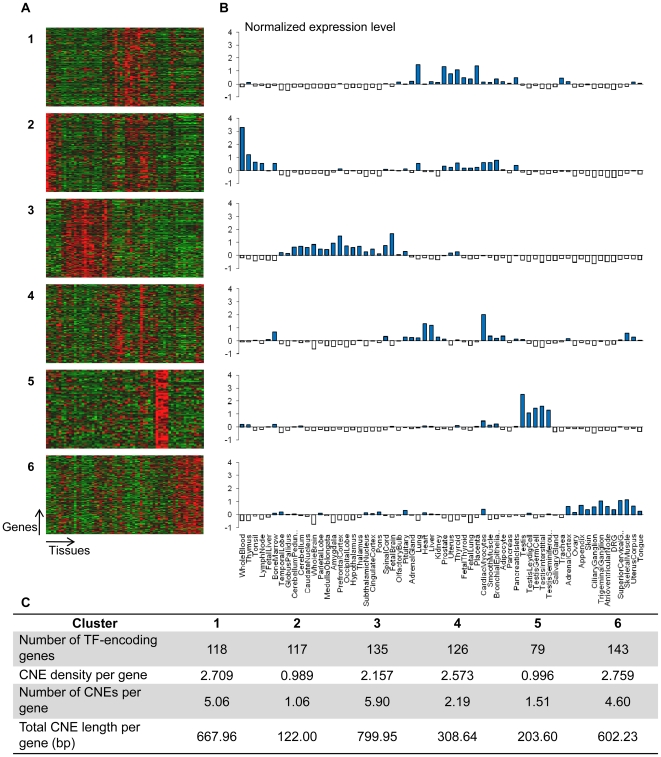
Figure 7. TF-encoding genes predominantly expressed in the central nervous system are enriched with CNEs.
(A, B) Tissue expression patterns of 718 human TF-encoding genes. (A) Each of the six panels displays a heat map. The rows and columns of each heat map represent human TF-encoding genes and 62 human tissues respectively. (B) Each graph represents the average gene expression levels of a cluster of TF-encoding genes. Expression cluster #3 consists of genes that predominantly express in the central nervous system. (C) The table pertains to the CNE density (CNE bases per kb of noncoding sequence in a human gene locus), the number and total length of CNEs per TF-encoding gene in different expression clusters.

