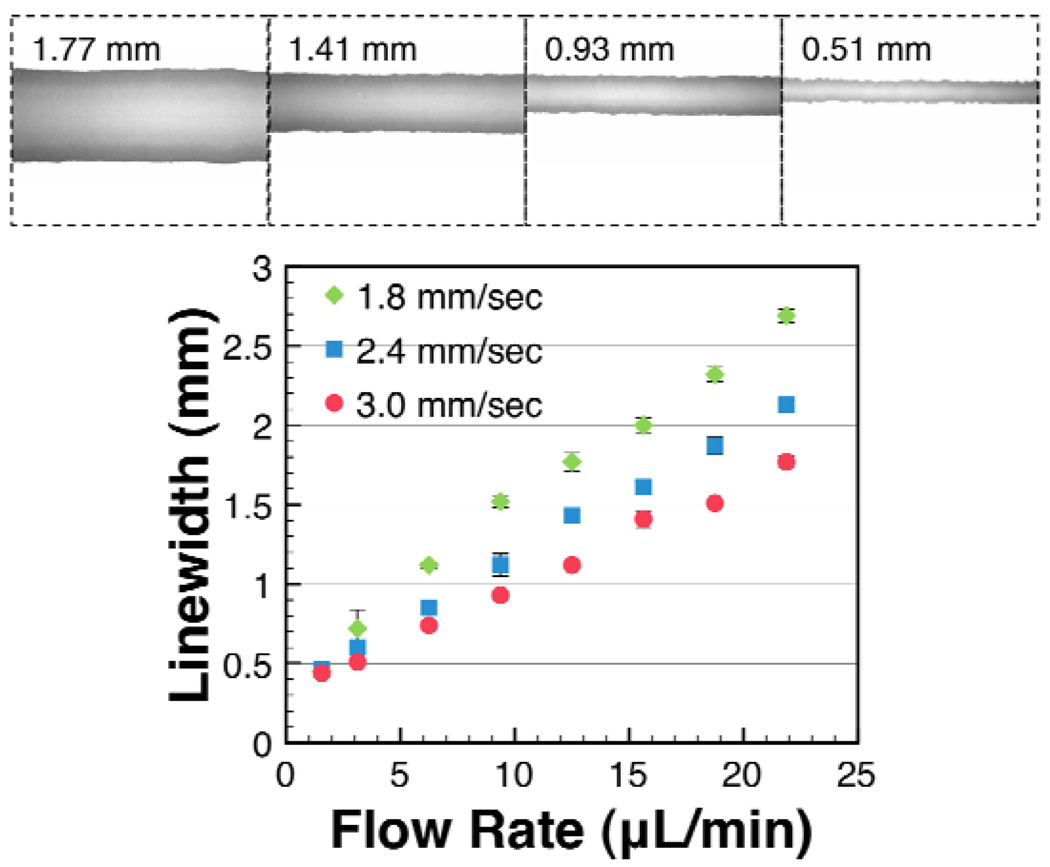
Figure 2.
Characterization of dye deposition (top) and linewidths (bottom). Blue food coloring in PBS buffer was striped onto nitrocellulose membranes. The top panel shows line images and linewidths for dye deposited at an SP2 translation speed of 3 mm/sec, and SP1 flow rates of 21.9, 15.6, 9.4, and 3.1 µL/min, respectively (top, left to right). Microscopy images (top) showed the dye was more concentrated at the lines’ edges than in the middle. The distribution of the dye may not resemble the distribution of proteins, which often bind more rapidly to the membrane than do small dye molecules. The linewidth measured 3 cm from the starting point of the line was found to scale linearly with the flow rate (bottom). For a given flow rate, faster translation speeds resulted in narrower lines.

