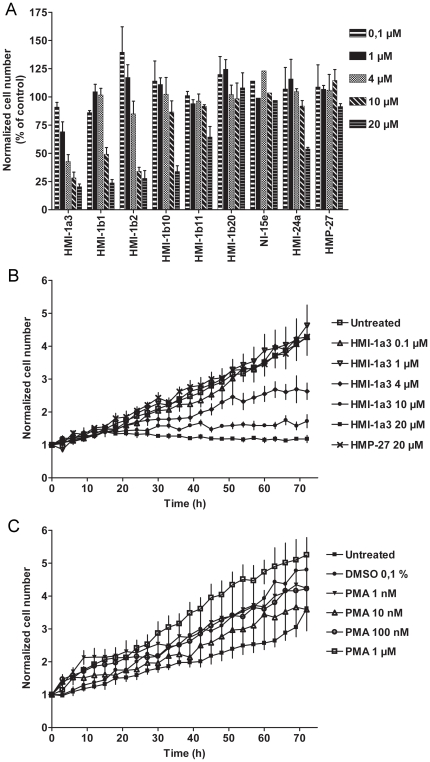
Figure 4. Effects of isophthalate derivatives and PMA on HeLa cell proliferation.
HeLa cells were treated with test compounds and photographed automatically for 72 h with Cell-IQ®. Cell numbers were quantified from each image using Cell-IQ Analyzer® software. A, normalized total cell number at 72 h is expressed as a percentage of control. Results represent mean + SEM from 3–5 independent experiments except for NI-15e where n = 2. B and C, proliferation of HeLa cells during the 72-h experiment is shown as normalized total cell number in untreated wells and after treatment with different concentrations of HMI-1a3 and HMP-27 (B) and PMA (C). Cell numbers shown were determined from images taken with 3-h intervals from a single, representative experiment. Error bars correspond to SEM of 4 images taken from different positions within the same well. Experiments were repeated at least 3 times with similar results.

