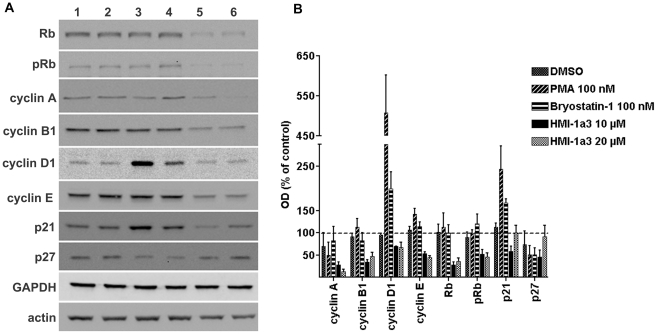
Figure 7. Effects of C1 domain ligands on the expression of cell cycle markers.
HeLa cells were exposed to compounds for 24 h and proteins were detected with Western blotting. A, representative Western blots showing specific immunoreactive bands after various treatments (lanes 1–6) as follows: lane 1, untreated cells; lane 2, 0.2% DMSO; lane 3, PMA at 100 nM; lane 4, bryostatin 1 at 100 nM; lane 5, HMI-1a3 at 10 µM; lane 6, HMI-1a3 at 20 µM. B, quantification results of Western blots expressed as mean + SEM (n = 3-4). OD = optical density.

