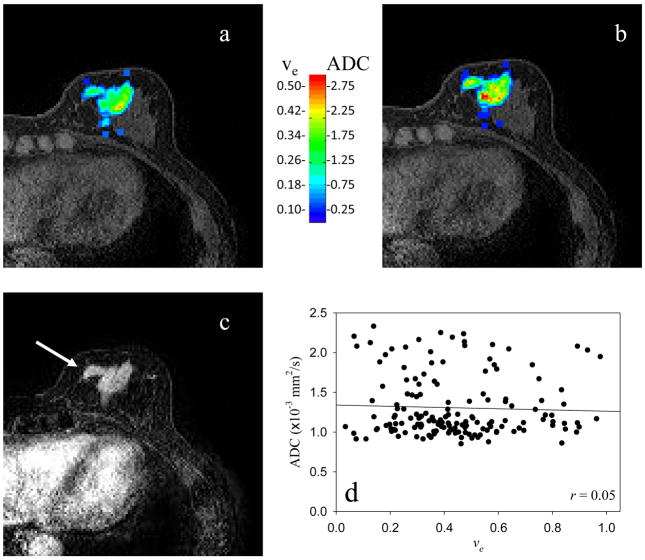
Figure 1.
Panels a and b depict the parametric maps of the extravascular extracellular volume fraction and the apparent diffusion coefficient, respectively, of the central slice of a representative patient. (Note the color bar where the ADC values are given in units of 10−3 mm2/s.) Panel c depicts the initial area under the contrast enhanced curve so that the enhancing lesion is easily visualized (arrow). Panel d depicts the scatter plot of the data presented in panels a and b, and it is clear that there is not a strong correlation between the data sets. These data were obtained in the clinical setting on a 1.5T scanner.

