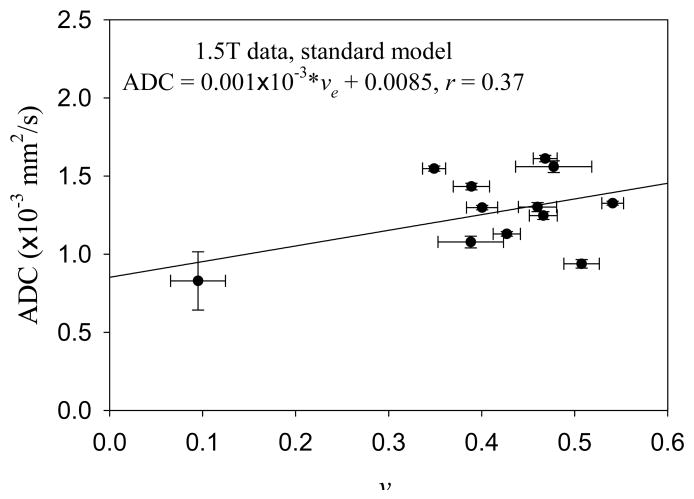
Figure 2.
The figure displays data similar to that found in Figure 1d, except these points represent the average of all voxels for a given patient; the error bars denote the standard error of the mean. Again, there is not a strong relationship between ADC and ve data obtained at 1.5T.

