
Figure 3. CG-DMRs identified between pluripotent cells.
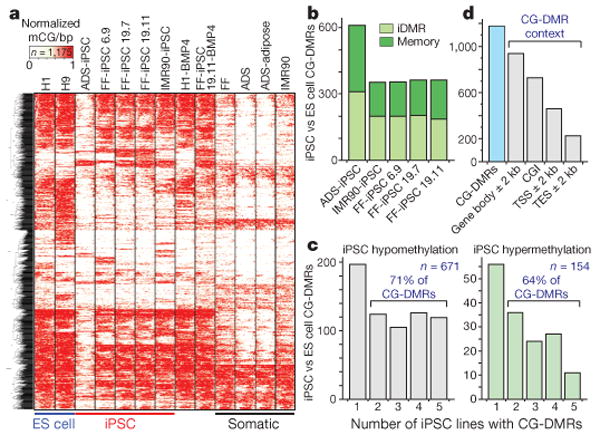
a, Complete linkage hierarchical clustering of mCG density within CG-DMRs identified between all ES cell and iPSC DNA methylomes. Each CG-DMR was profiled over 20 equally sized bins. b, The CG-DMRs for each iPSC line with respect to H1 and H9 ES cells were categorized as having methylation patterns like the progenitor somatic cell line (memory) or iPSC-specific (iDMR). c, Number of iPSC hypomethylated and hypermethyated CG-DMRs aberrant in the indicated number of iPSC lines. d, Number of all CG-DMRs coincident with indicated genomic and genic features. CGI, CG island; TES, transcriptional end site; TSS, transcriptional start site.