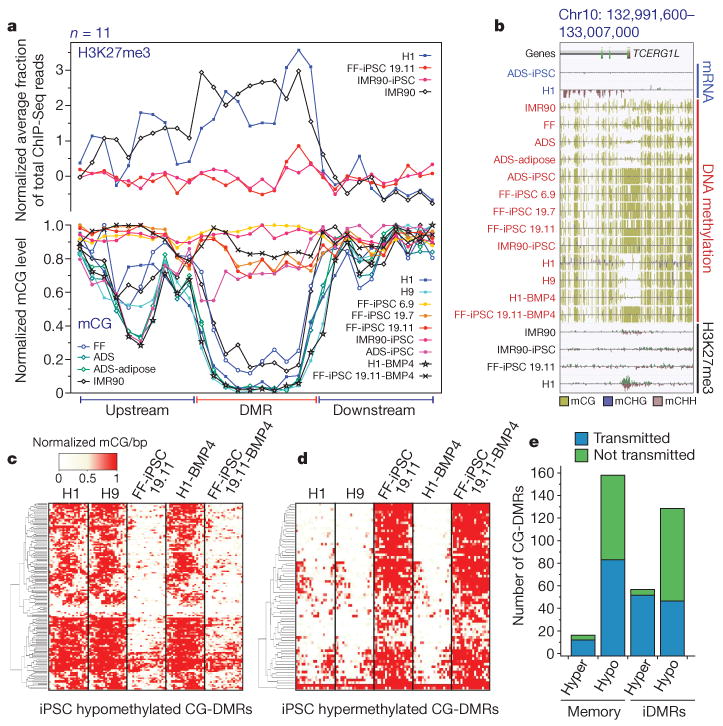
Figure 4. Characterization of CG-DMRs in iPSCs.

a, Normalized mCG levels (lower y-axis) and normalized H3K27me3 ChIP-Seq read density (upper y-axis) over CG-DMRs hypermethylated in all iPSC lines and flanking genomic regions. b, Data browser representation of mRNA, DNA methylation and H3K27me3 density for a CG-DMR identified in all iPSC lines. c, Complete linkage hierarchical clustering of mCG density within the CG-DMRs hypomethylated in both FF-iPSC 19.11 and FF-iPSC 19.11-BMP4 relative to H1, H9 and H1-BMP4 cell lines. Each CG-DMR was profiled over 20 equally sized bins. d, Same as c for hypermethylated CG-DMRs. e, FF-iPSC 19.11 CG-DMR transmission through differentiation to trophoblast cells. CG-DMRs were categorized by methylation state relative to the ES cells (hyper, hypermethylated; hypo, hypomethylated), similarity to somatic progenitor methylation (memory: like progenitor; iDMR: unlike progenitor), and whether the CG-DMR was present in FF-iPSC 19.11 differentiated into trophoblast cells with BMP4 (transmitted) or not (not transmitted).
