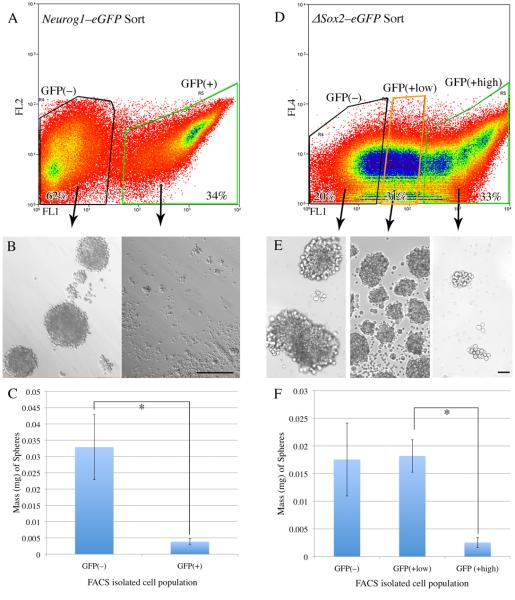
Figure 3. Neurog1eGFP(+) cells do not form olfactory neurospheres, while a subset of ΔSox2eGFP(+) cells do.
A) Neurog1eGFP neonatal OE was dissociated and sorted into GFP(−) and GFP(+) fractions (62% and 34% of cells, respectively). Cells were gated on forward scatter/side scatter and pulse width to restrict the sort to single cells. Cells were also gated as propidium iodide negative (PI[−]) indicating viability. The cells were then cultured under ONS–forming conditions. B) Brightfield examination of the two different sorted populations from Neurog1eGFP neonates at 7 DIV demonstrates ONS formation in the GFP(−) population and negligible ONS formation in the GFP(+) population. C) Quantitative analysis of the two different Neurog1eGFP sorted populations at 7 DIV indicates that the mass of spheres formed by the GFP(−) population is more than four–fold greater than the mass derived from the GFP(+) population (p = 0.0313, Wilcoxon matched–pairs signed–ranks test). D) ΔSox2eGFP neonatal OE was dissociated and sorted into GFP(no), GFP(low), and GFP(high) populations (20%, 31%, and 33% of PI(−) cells, respectively). E) Brightfield examination of the cultures from the three different sorted populations at 7 DIV demonstrates robust ONS formation in the GFP(low) and GFP(no) populations, but poor ONS formation in the GFP(high) population. F) Quantitative analysis of sphere formation from the three different ΔSox2eGFP sorted populations at 7 DIV indicates that the mass of spheres from the GFP(low) population is approximately four-fold greater than the mass of the GFP(high) population (Kruskal-Wallis, KW = 7.848, p= 0.0009, Dunn's multiple comparisons test for GFP(high) vs. GFP(low), p < 0.05).

