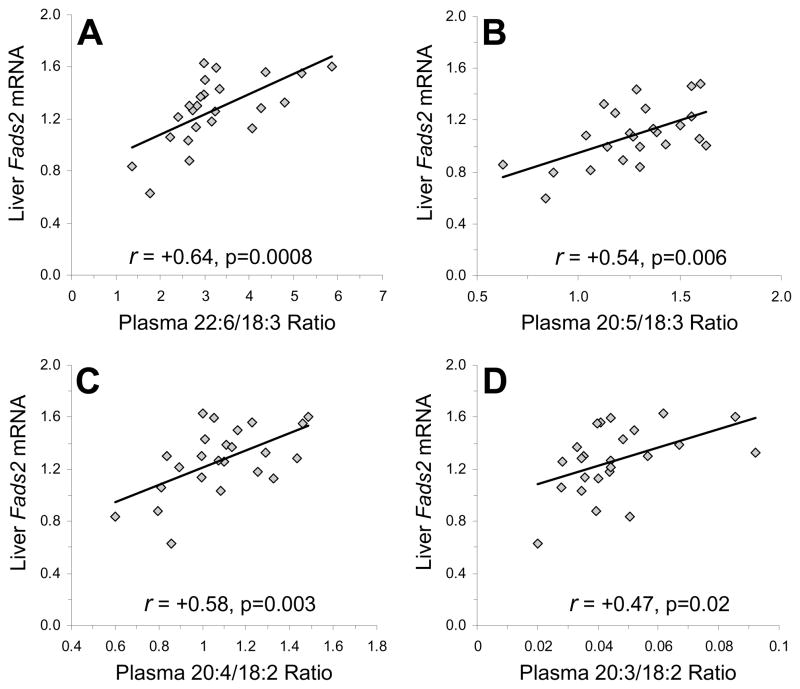
Fig. 5.
Relationship between liver Fads2 mRNA expression and the plasma 22:6/18:3 (A) and 20:5/18:3 (B) ratios (indices of n-3 fatty acid biosynthesis), and the plasma 20:4/18:2 (C) and 20:3/18:2 (D) ratios (indices of n-6 fatty acid biosynthesis) in rats treated with drug vehicle, RSP (3 mg/kg/d), or PAL (3 mg/kg/d)(n=24). Pearson correlation coefficients and associated p-values (two-tailed) are presented.

