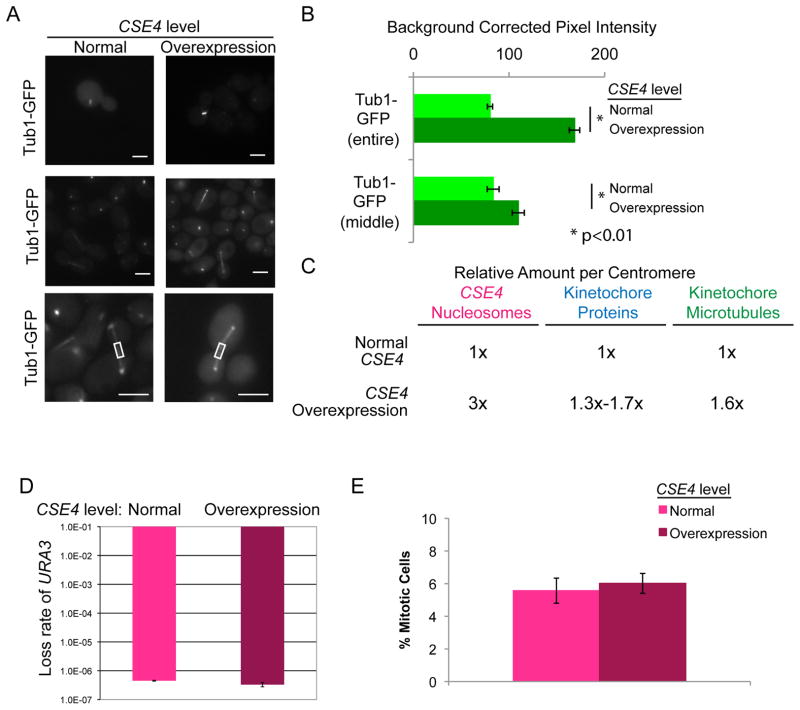
Figure 3. Additional spindle microtubules localize to centromeres when CENP-A is overexpressed.
(A) CSE4/PCK1p-CSE4 strains with Tub1-GFP were grown in repressing conditions (SDC-glucose - normal expression, left image panels) and grown in activating conditions (SDC-succinate- overexpression, right image panels) for 6 h. Cells were imaged at 1000X total magnification with a GFP filter set. Upper panels show representative metaphase spindles and middle panels show representative anaphase spindles. Lower panels show increased magnification and example middle regions measured. Scale bar = 2μm. (B) GFP fluorescence was quantified by selecting the mitotic spindle region in each cell (upper bars) or the middle of the mitotic spindle region (lower bars) and measuring total pixel intensity in the region, corrected for background fluorescence. Data shown are mean ± SEM for at least 50 cells/experiment for 4 biological replicates. The difference in mitotic spindle GFP fluorescence between normal expression of CSE4 and overexpression of CSE4 was statistically significant (p<0.0001 for entire spindles, p<0.01 for middle of spindles) using a two-tailed unpaired Student’s t-test (*). (C) Summary of estimated number of kinetochore proteins and kinetochore-microtubule attachments with normal CSE4 expression and overexpression of CSE4. (D) Fluctuation analysis of loss of URA3 in CENP-A/PCK1p-CENP-A strains during growth in repressing conditions (YPA-glucose - normal expression) and growth in activating conditions (YPA-succinate - overexpression). Loss of URA3 was quantified by plating cells on non-selective media (YPA-Glucose) to obtain total numbers of cells and on media containing 5-FOA to select for loss of URA3. Colony counts were used to calculate the rate of FOA/cell division. Results are the mean ± standard deviation of the rates calculated from two experiments, each with 20 cultures per condition. (E) CSE4/PCK1p-CSE4 strains with Tub1-GFP were grown as in (A). The percentage of cells with mitotic spindles was counted. Data shown are mean ± SEM.

