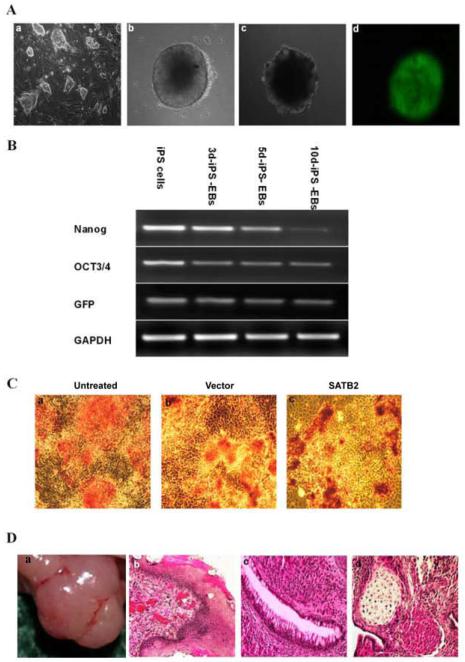
Figure 1. Gene expression patterns of mouse iPS cells.
(A) Representative pictures of (a) mouse induced pluripotent (iPS) cells (ST-8) with the layer of inactivated MEF cells (200×); (b) Two days after culture with a hanging drop, representative pictures of mouse iPS embryoid body formation (EBs) (200×); (c) the EBs were transferred into a Petri dish and maintained for 5 days in suspension culture, and plated on gelatin-coated dish in differentiation medium on day 7(200×); (d) iPS cell-derived embryoid bodies expressed green fluorescent protein by fluorescence view(200×). The EBs were transduced with pBABE-hygro-SATB2 at days 0, 2, and 5 during suspension culture in the Petri dish. (B) Total RNA was isolated from mouse iPSCS (lane 1), 3d-iPS-EBs (lane 2), 5d-iPS-EBs (lane 3), or 10d-iPS-EBs (lane 4), and semi-quantitative RT-PCR was carried out using primers for Nanog, Oct-3/4, GFP and GAPDH as described in the Materials and Methods. (C) Mouse iPSCs were transduced with pBABE-hygro-Vector or pBABE-hygro-SATB2. Three days later, alkaline phosphatase (ALP) staining was observed by light microscopy(100×). (a) untreated; (b) Vector; (c) SATB2. (D) Teratomas formation derived from Vector-transduced iPSCs were prepared, the tumor was resected (a), and sections were stained with hematoxylin and eosin: (b), ectoderm (epidermis); (c), endoderm (gut epithelium); and (d), mesoderm (cartilage and muscle) (200×).

