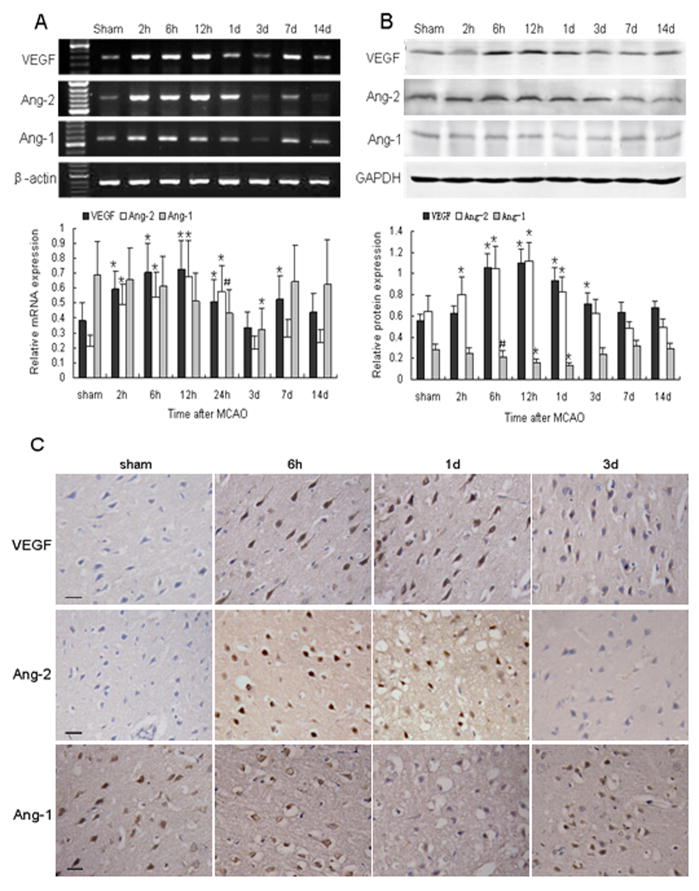
Fig. 2.
Changes in expression of VEGF, Ang-1, and Ang-2 after MCAO. (A) (Top) RT-PCR of VEGF, Ang-1, and Ang-2 mRNA at the indicated time points after MCAO; (Bottom) bar graph showing mRNA expression relative to that of β-actin. (B) (Top) Western blot of VEGF, Ang-1, and Ang-2 at the indicated time points after MCAO; (Bottom) bar graph showing protein expression relative to glyceraldehyde 3-phosphate dehydrogenase (GAPDH). Data are presented as means ± S.D.; n = 6/group; #P < 0.05, *P < 0.01. (C) Immunohistochemical staining revealed VEGF and Ang-2 immunoreactivity in neuron-like and glial-like cells in the ischemic boundary area after MCAO. Ang-1 immunostaining was especially weak at 1 day after ischemia. Scale bar = 20 μm.

