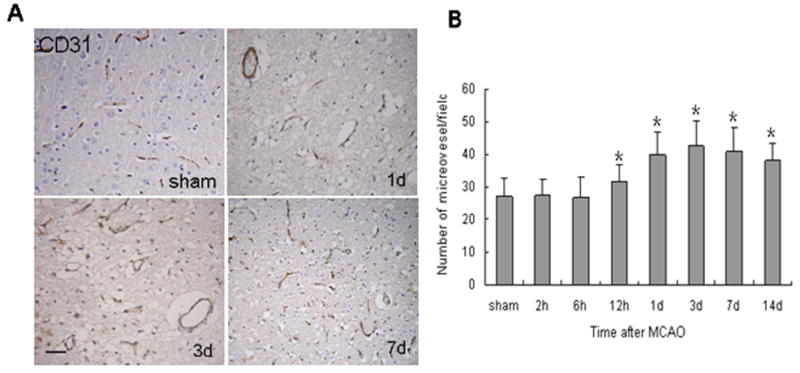
Fig. 3.

Neovascularization in rat brain after MCAO. (A) Brain sections were immunostained for CD31 to identify capillaries. Scale bar = 50 μm. (B) The bar graph shows microvessel counts at different time points after MCAO. Microvessels were counted from 10 fields of the ischemic penumbra area under a microscope at 400× magnification. Data are means ± S.D.; n = 7 per group; *P < 0.01 compared with the sham group.
