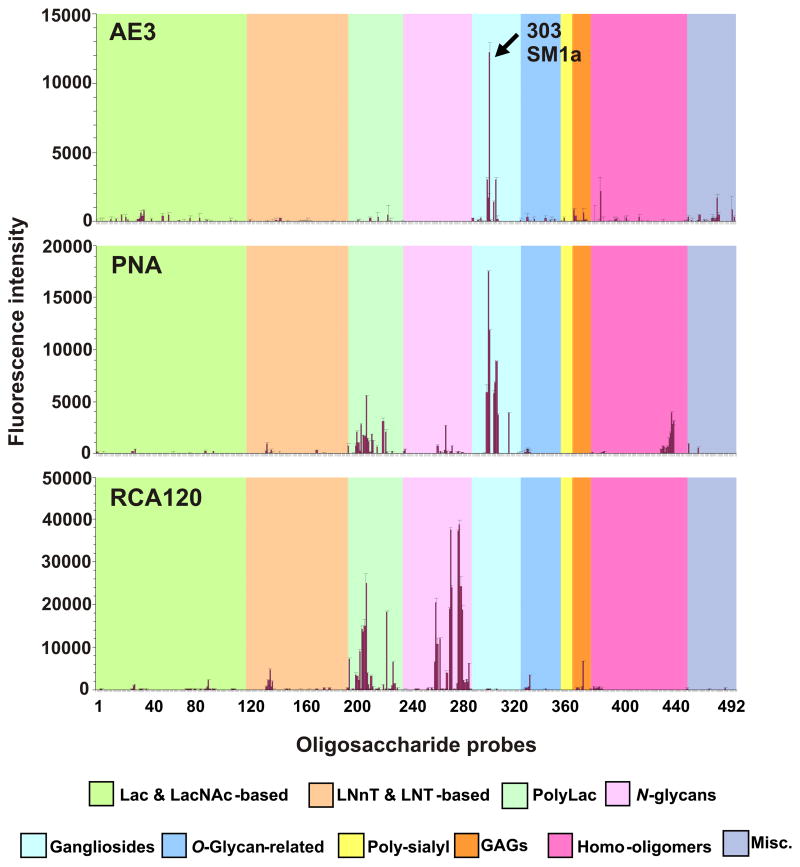
Fig. 1.
Microarray screening analyses of monoclonal antibody AE3 and the lectins peanut agglutinin (PNA) and Ricinus communis agglutinin I (RCA120). The results are the means of fluorescence intensities of duplicate spots, printed at 5 fmol. The error bars represent half of the difference between the two values. In the glycan array the 492 lipid-linked probes (> 370 mammalian type) are grouped according to their backbone sequences as annotated by the colored panels: disaccharide based: lactose (Lac) and N-acetyllactosamine (LacNAc); tetrasaccharide based: lacto-N-neo-tetraose (LNnT) and lacto-N-tetraose (LNT); poly-N-acetyllactosamine (PolyLac); N-glycans; gangliosides; O-glycan-related; polysialyl; glycosaminoglycans (GAGs); homo-oligomers of glucose and of other monosaccharides, and other non-classified sequences (miscellaneous, Misc).

