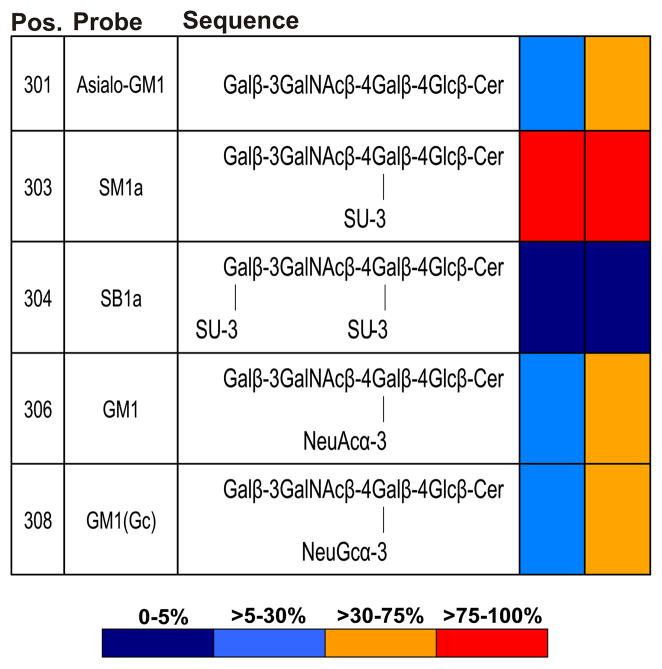
Fig. 2.
Relative intensities of binding of antibody AE3 and PNA to five glycolipids sharing the asialo-GM1 backbone sequence, Galβ-3GalNAcβ-4Galβ-4Glc in the microarray screening analyses. Relative binding intensities are shown as the percentage of the fluorescence signal intensity relative to that given by SM1a, the glycolipid most strongly bound by each protein at 5 fmol per spot. Pos., positions in the microarray in Fig. 1 and Supplementary Table 1.

