Figure 2.
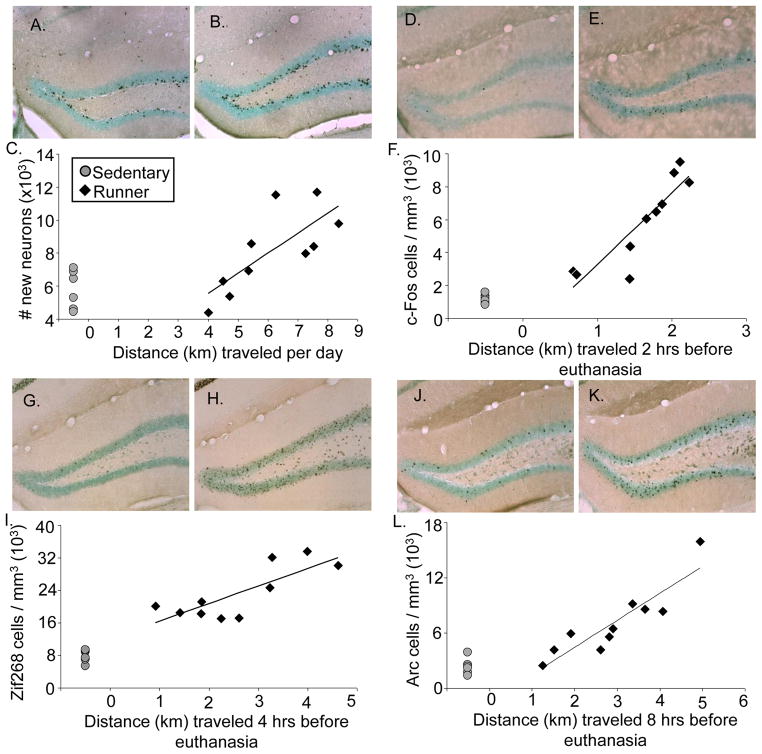
IEG induction and neurogenesis from wheel running. A) Representative coronal section stained for BrdU-DAB (combined with a light Nissl stain to highlight the dentate gyrus) of an animal euthanized in the sedentary condition (50X total magnification) B) same as A except representing the runner condition. C) Total number of new neurons shown for individual mice plotted against average daily running distance in km. D) Representative coronal section stained for c-Fos-DAB (combined with a light Nissl stain to highlight the dentate gyrus) of an animal euthanized in the sedentary condition (50X total magnification) E) same as D except representing the runner condition F) Number of c-Fos positive cells per cubic mm shown for individual mice plotted against distance run in km accumulated within 2 hrs before euthanasia. G) Representative coronal section stained for Zif268-DAB (combined with a light Nissl stain to highlight the dentate gyrus) of an animal euthanized in the sedentary condition (50X total magnification) H) same as G except representing the runner condition I) Number of Zif268 positive cells per cubic mm shown for individual mice plotted against distance run in km accumulated within 4 hrs before euthanasia. J) Representative coronal section stained for Arc-DAB (combined with a light Nissl stain to highlight the dentate gyrus) of an animal euthanized in the sedentary condition (50X total magnification) K) same as J except representing the runner condition L) Number of Arc positive cells per cubic mm shown for individual mice plotted against distance run in km accumulated within 8 hrs before euthanasia. Sedentary mice are represented as grey circles and runners as black diamonds.

