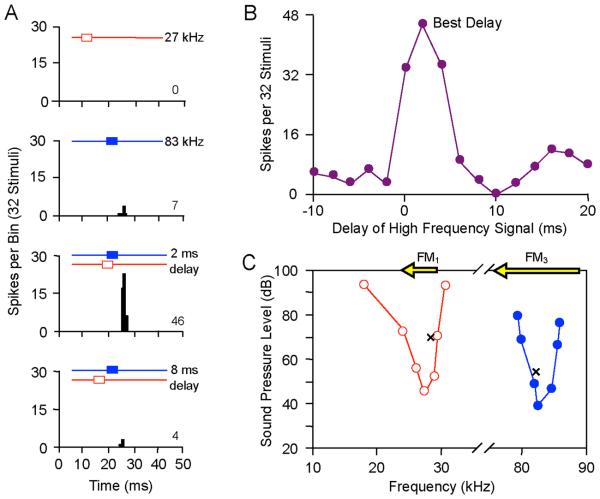
Figure 2.
FM-FM neuron in the mustached bat's inferior colliculus. A. Peristimulus time histograms show that this neuron responded weakly to individual tone bursts in the FM1 and FM3 ranges, but was strongly facilitated by the combination when the signal in the FM3 frequency range was delayed by 2 ms. The strength of the facilitation was quantified by an index value that compares the response to the combination with the response to the separate tonal elements (Dear and Suga, 1995). Facilitation index values range from 0.09 (20% facilitation, our threshold for facilitation) to 1.0 (maximum facilitation). This neuron has a facilitation index value of 0.75. B. The response is delay-tuned, with maximum response at the best delay. C. The facilitation is tuned to two frequency bands (arrows at top), one within the FM1 sonar component and the other within the FM3 sonar component. The best frequency (BF) of 83 kHz is based on responses to single tone bursts and is within the frequency band of the FM3 component. Adapted with permission from Portfors and Wenstrup (1999), J. Neurophysiol., Am. Physiol. Soc.

