
Fig. 3.
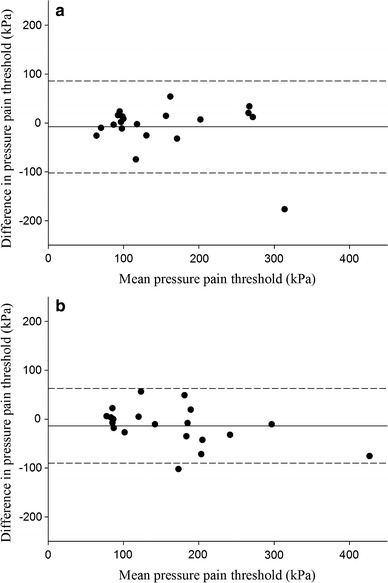
Intrarater agreement for pressure pain threshold at the lower leg and at the thenar in 20 children. Bland–Altman plot. Each dot represents the difference between two measurements plotted against the mean of the two measurements. Both measurements were obtained in the same child by rater 1. a Lower leg. The horizontal line (−7.85 kPa) represents the mean value of the difference for 20 children, and the upper (86.4 kPa) and lower (−102.1) limits of agreements are shown as dotted lines; SD: 48.1 ± 1.96. b Thenar. The horizontal line (−13.9 kPa) represents the mean value of the difference for 20 children, and the upper (63.1 kPa) and lower (−90.9 kPa) limits of agreements are shown as dotted lines; SD: 39.3 ± 1.96