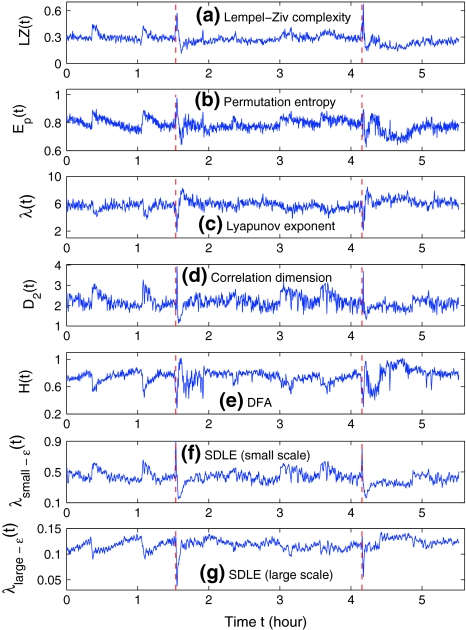
Fig. 3.
The variation of a the LZ complexity, b the PE, c the LE, d the D2, e the Hurst parameter, f , and g
 with time for part of the EEG signals of patient #P93. The EEG signal is from the electrode RTD 1. The vertical red dashed lines indicate seizure occurrence time determined by medical experts. On average, a seizure lasts about 1–2 min, which is equivalent to 6–10 sample points in these plots

