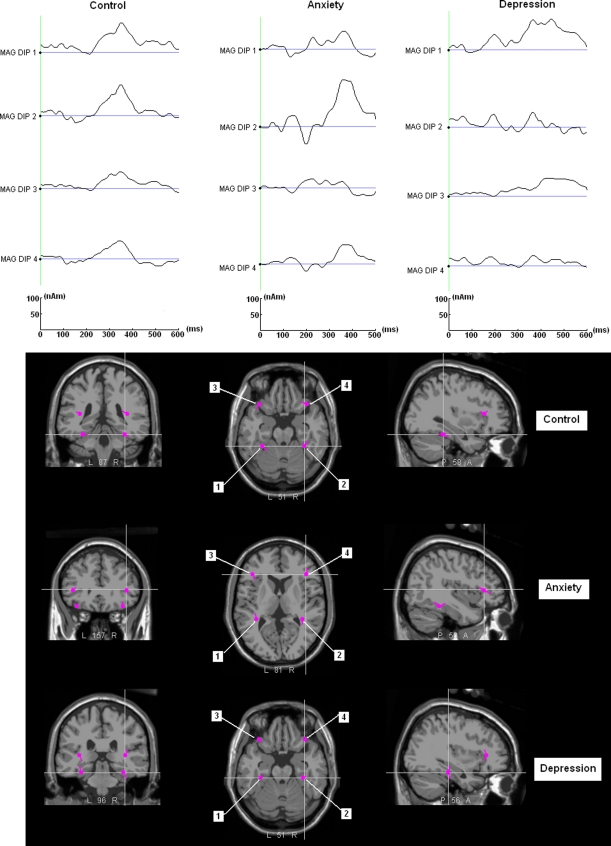
Fig. 4.
The upper part presents grand average dipole source waveforms of the healthy control and patient groups, where two kinds of P300 activities are observed in each group, monophasic P300 peak and small P300 peak followed by a slow negative wave. The low part illustrates dipole locations and orientations superimposed on MNI305 anatomical template brain

