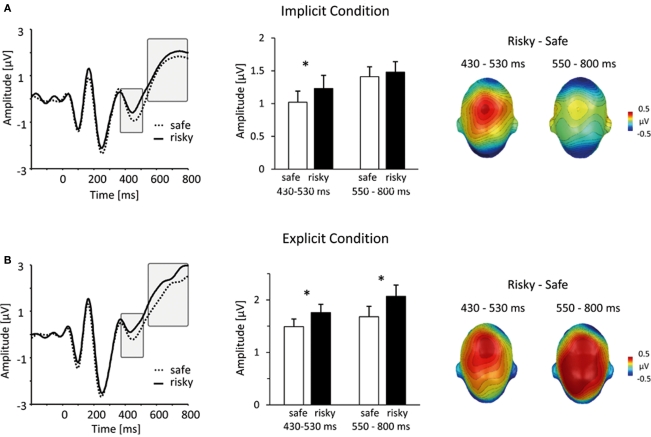
Figure 3.
Similarities and differences between implicit and explicit conditions. (A) In the implicit condition, viewing persons that were subsequently judged as risky elicited a mid-latency central positivity. The left panel shows representative grand-average ERP waveforms for risky (solid lines) and safe (dotted lines) persons (sensor #257, corresponding to Cz in the 10/20 system). The bar plot in the middle panel summarizes mean ERP amplitudes, captured over a central cluster at an earlier (430–530 ms) and later (550–800 ms) interval (unfilled bars: safe persons, filled bars: risky persons). The right panel illustrates the scalp topography of differences between risky and safe ERPs, projected on a model head (top view). (B) This panel shows the same information for the results from the explicit condition. Notably, between 430 and 530 ms, implicit and explicit conditions revealed a similar differentiation between risky and safe persons. In contrast, in the time window between 550 and 800, larger central positivities for risky persons were specific to the explicit condition.

