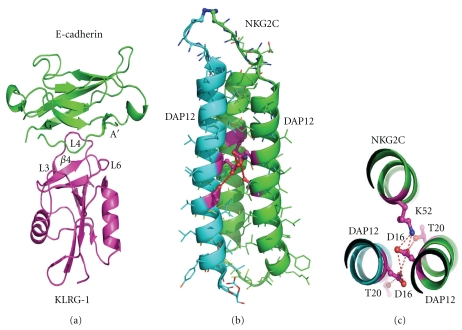
Figure 9.
(a) Structure of KLRG1 in complex with E-cadherin shown in cartoon representation with the critical KLRG-1 loop regions which interact with the E-cadherin A′ and G sheet regions labeled. (b) Cartoon representation of the heterotrimeric NKG2C DAP12 transmembrane complex with interacting residues shown in ball and stick representation with bonding network shown by dashed lines. (c) View from above the membrane showing a closeup of the interacting residues and bonding interactions.

