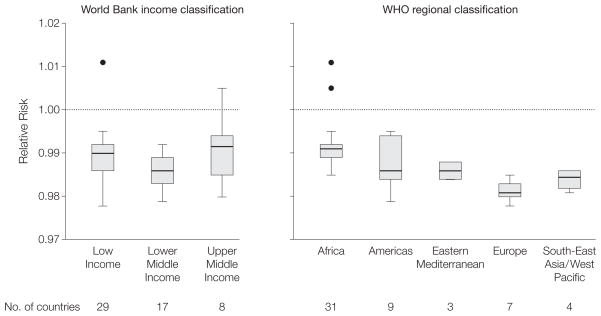
Figure 2.
Box Plots of Relative Risk for the Association Between 1-cm Increase in Maternal Height and Offspring Mortality Among Children by World Bank Income Classification and WHO Regional Classification of Countries
WHO, World Health Organization; IQR, interquartile range. Plotted on log scale. For World Bank income classification, low income indicates $975 or less; lower middle income, $976–$3855; upper middle income, $3856–$11 905 (2008) gross national income per capita. Boxes indicate first and third quartiles with median lines; whiskers indicate first quartile minus 1.5 × IQR and third quartile + 1.5 × IQR; all values outside the whiskers are shown as filled circles (outliers). An interactive information graphic is available at http://www.jama.com.

