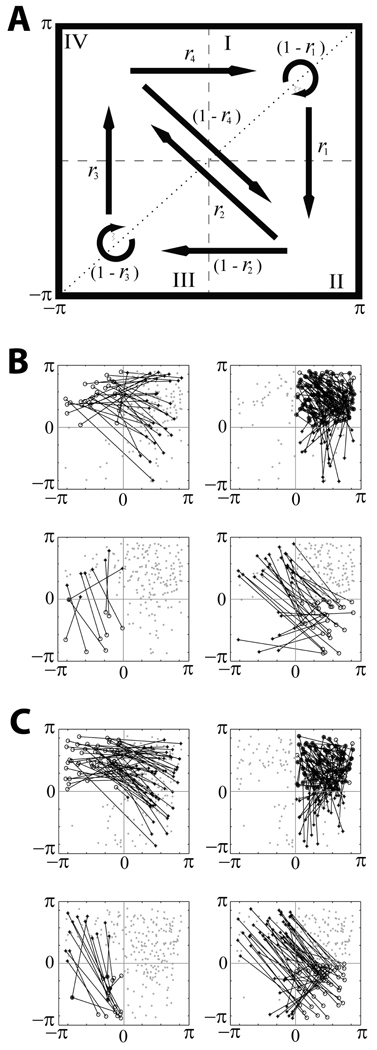
Fig. 2.
First-return maps. A is the diagram of the map. The phase space is partitioned into four regions; arrows indicate all possible transitions between them, transition rates are written next to the arrows. B and C present examples of the maps derived from experimental and model data respectively. Four maps in B and C have the same data points, lines illustrates the transitions from points in different regions.

