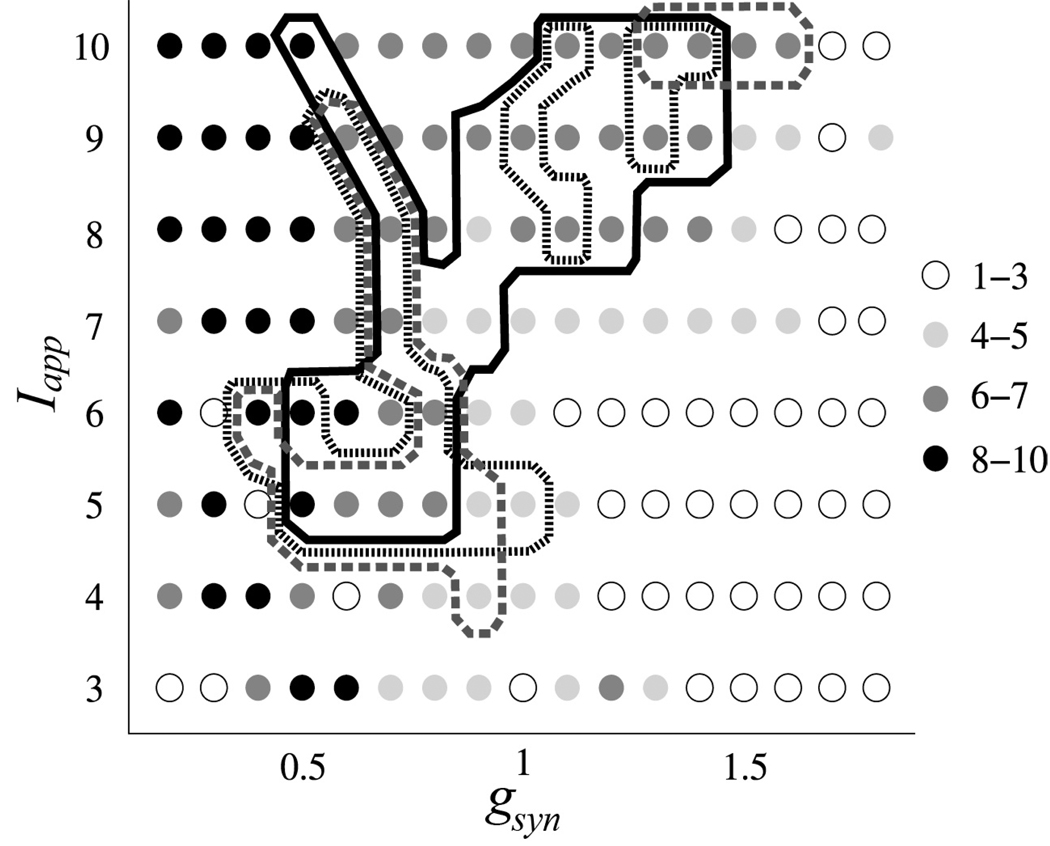
Fig. 4.
The model dynamics in dependence on gsyn and Iapp vs experimental data. The circles indicate the number of principle components capturing 80% of variation in the principle component analysis for the slow variables r of all STN cells in the model. The lines represent the contours of the parameter domains, where the model rates ri characterizing the temporal structure of synchronization are within 0.7SD of the experimental rates. Solid, dotted and dashed lines correspond to different values of the weights used to compute model LFP (0.26, 0.3, and 0.35).

