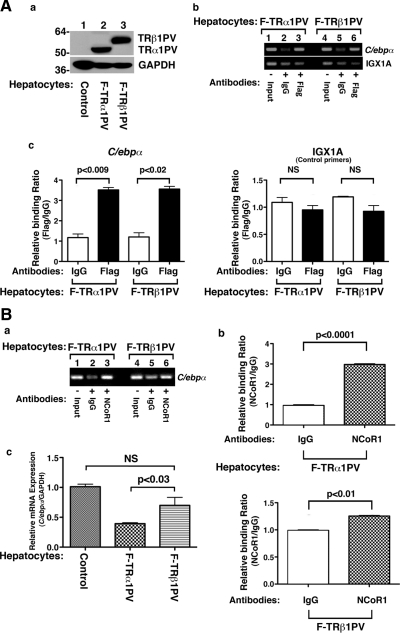
Fig. 6.
NCoR1 is more avidly recruited by TRα1PV than by TRβ1PV to the promoter of the C/ebpα gene. Primary mouse hepatocytes were prepared as described in Materials and Methods and infected with adenovirus encoding F-TRα1PV (lane 2, A-a) and F-TRβ1PV (lane 3, A-a), respectively. A-a, Identical amount of TRα1PV and TRβ1PV were expressed in hepatocytes. A-b, ChIP assay was carried out using anti-Flag antibody (A-b, lanes 3 and 6) or anti-NCoR1 antibody (PHQQ) (B-a, lanes 3 and 6) or IgG as controls (A-b and B-a, lanes 2 and 5) as described in Materials and Methods. Lanes 1 and 4 in A-b and B-a are input control. Shown is a representative result of three experiments. A-c, The intensities of bands shown in panels b of A and panel a of B were quantified by densitometry analysis, and data are shown as reference to the intensity of IgG as 1. The negative controls of using IGX1A (control primers) are also shown. B-c, The expression of C/ebpα mRNA was more repressed in hepatocytes expressing TRα1PV than expressing TRβ1PV (lanes are as marked). Mouse primary hepatocytes were tranduced with adenovirus encoding Flag-tagged TRα1PV, TRβ1PV, or control virus as shown in Fig. 6A-a. Total RNA (200 ng) prepared as described in Materials and Methods was used in real-time quantitative PCR analysis. Glyceraldedyde 3-phosphate dehydrogenase primer was used as an internal control. Data are expressed as mean ± sem (n = 4). NS, Nonsignificant (P = 0.3094).

