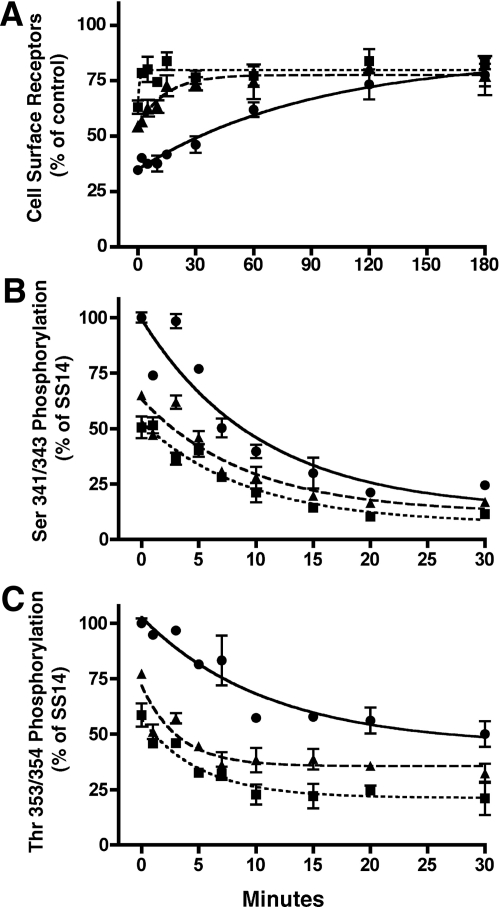
Fig. 6.
Rate of sst2A receptor recycling and dephosphorylation after treatment with different agonists. CHO-sst2A cells were incubated for 30 min at 37 C in the absence of agonist or in the presence of 100 nm SS14 (●), 1 μm KE108 (▴), or 1 μm SOM230 (■). After peptide treatment, cells were washed and incubated at 37 C in fresh media without agonist but in the presence of 100 nm of the antagonist Coy-14. A, After different periods of recovery, cells were fixed with paraformaldehyde, and cell surface receptors were quantitated with anti-HA antibodies by ELISA as described in Materials and Methods. Receptors in treated samples were expressed as a percentage of receptors in untreated control cultures. Shown are replicate samples from a single experiment. Where not shown, error bars fell within the size of the symbols. B and C, After the incubation with antagonist, cells were fixed, and receptor phosphorylation was measured at Ser341/343 (B) or Thr353/354 (C) using the phosphosite-specific antibodies in a whole-cell ELISA. Receptor phosphorylation in treated samples was expressed as a percentage of the phosphorylation observed after treatment with SS14 for 30 min. The graphs represent the mean ± sem of triplicate samples in a representative experiment. In all three panels, rates of receptor dephosphorylation or receptor recovery were calculated using nonlinear regression curve fitting to a one-phase exponential curve with GraphPad Prism. Results from three to six independent experiments are summarized in Table 4.

