Fig. 6.
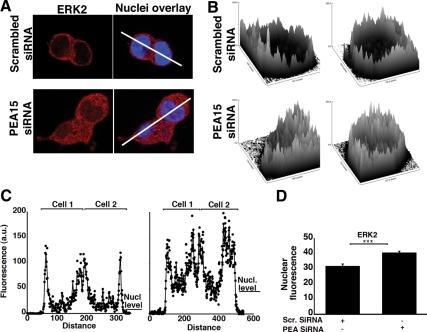
PEA-15 impedes the accumulation of ERK in the nucleus of nonstimulated cells. A, Resting LβT2 cells were transfected with either scrambled or PEA-15 siRNA. The cells were then fixed and stained with an anti-ERK2 antibody (red) and DAPI (blue), as described in Materials and Methods. White lines identify cross-sections in which fluorescence signal intensity was quantified in C. B, Surface plot analysis of ERK2 fluorescence from A using the Image J image processing program (NIH). C, Quantification of ERK2 fluorescence in the cross-sections indicated in A, using the Image J image processing program. Left plot, Scrambled siRNA; right plot, PEA-15 siRNA. D, Single-cell quantification of ERK2 nuclear fluorescence using the 3D-CatFISH image analysis suite (70, 71). Student t test, n = 102; ***, P < 0.005. Single-cell fluorescence distribution is also presented in Supplemental Fig. 7.

