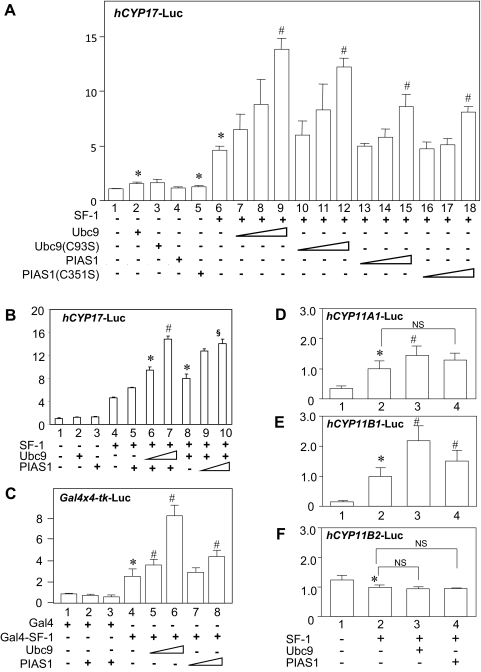
Fig. 2.
Effects of Ubc9 and PIAS1 on SF-1-mediated transcriptional activation. A, Ubc9 and PIAS1 enhance SF-1-mediated transcriptional activities of human CYP17 promoter in H295R cells. H295R cells were transfected with 610 ng of total DNA for each well of the 24-well dish, including 300 ng of hCYP17-Luc reporter, 100 ng of pRc/RSV-SF-1 or empty vector (pRc/RSV), increasing amounts (50, 100, and 200 ng) of pcDNA3.1/His-Ubc9 (or C93S mutants), or pcDNA3.1/His-PIAS1 (or C351S mutants) or empty vector (pcDNA3.1/His) along with 10 ng of phRL-null. B, Synergistic effects of Ubc9 and PIAS1 on the SF-1-mediated CYP17 transactivation. H295R cells were transfected with 300 ng of hCYP17-Luc reporter, 100 ng of pRc/RSV-SF-1, 100 ng of pcDNA3.1/His-PIAS1 along with 100 or 200 ng of pcDNA3.1/His-Ubc9 (lanes 5–7), or 100 ng of pcDNA3.1/His-Ubc9 along with 100 or 200 ng of pcDNA3.1/His-PIAS1 (lanes 8–10), and 10 ng of phRL-null. Empty vectors were used to make total DNA 610 ng for each well of 24-well dishes. C, Ubc9 and PIAS1 enhance Gal4-SF-1-mediated transcriptional activities of Gal4-responsive Gal4 × 4-tk-Luc promoter in COS-7 cells. COS-7 cells were transfected with 610 ng of total DNA for each well of the 24-well dish, including 300 ng of Gal4 × 4-tk-Luc reporter, 100 ng of Gal4-SF-1 or Gal4, and increasing amounts (100 and 200 ng) of pcDNA3.1/His-Ubc9 and/or pcDNA3.1/His-PIAS1 along with 10 ng of phRL-null. D–F, Effects of Ubc9 and PIAS1 on CYP11A1, CYP11B1, and CYP11B2 gene promoters. H295R cells were transfected with 610 ng of total DNA for each well of the 24-well dish, including 300 ng of hCYP11A1-Luc (D), hCYP11B1-Luc (E) or hCYP11B2-Luc (F) reporter, 100 ng of pRc/RSV-SF-1 or empty vector (pRc/RSV), 200 ng of pcDNA3.1/His-Ubc9 or pcDNA3.1/His-PIAS1 or empty vector (pcDNA3.1/His) along with 10 ng of phRL-null. Forty-eight hours after transfection, cells were harvested and the extracts were measured luciferase activities. All transfection efficiency was normalized using corresponding Renilla activity. Assays were performed with at least triplicate samples. Statistically significant differences are indicated as follows: *, P < 0.05 vs. bar 1; #, P < 0.05 vs. bar 6 (A), bar 5 (B), bar 4 (C), or bar 2 (D–F); §, P < 0.05 vs. bar 8 (B).

