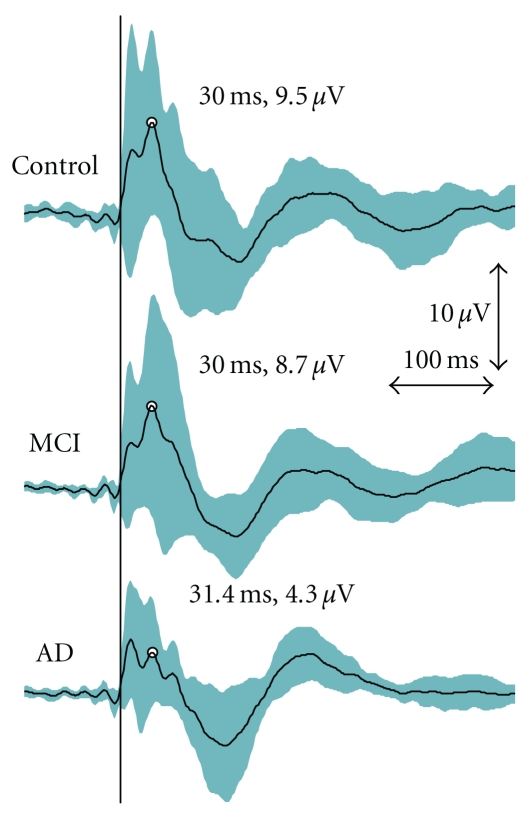
Figure 2.
Grand average curves for TMS-evoked EEG responses as measured from the central electrode (CZ). The mean peak for the P30 has been indicated. However, P30 was analyzed for individuals from the electrode chosen based on the shortest latency and clearest identification on the stimulated hemisphere. The turquoise area represents the 95% confidence interval for the TMS-EEG responses. The vertical black line indicates the moment of stimulation.

