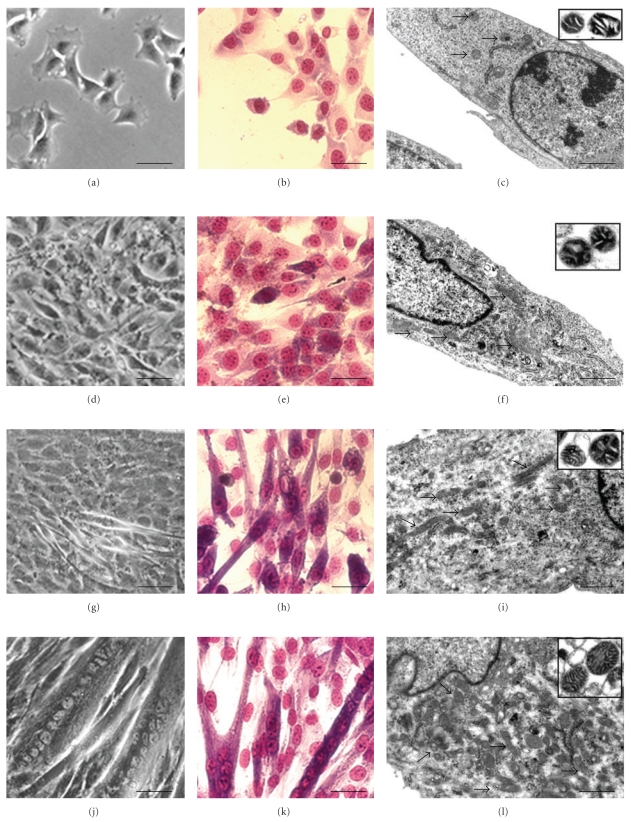
Figure 1.
Undifferentiated (a, b, c), early differentiation (d, e, f), intermediate differentiation (g, h, i) and late differentiation stages (j, k, l), are indicated by RM (a, d, g, j), Giemsa staining (b, e, h, k), and TEM (c, f, i, l). Mitochondrial morphology is further detailed by the correspondent insets, showing TEM analysis of isolated mitochondria. C2C12 cell differentiation morphological progression is evident, as well as mitochondrial behaviour in the various stages. (a, b, d, e, g, h, j, k): Bar = 20 μm; (c, f, i, l): Bar = 0.5 μm; insets, Bar = 0.1 μm.

