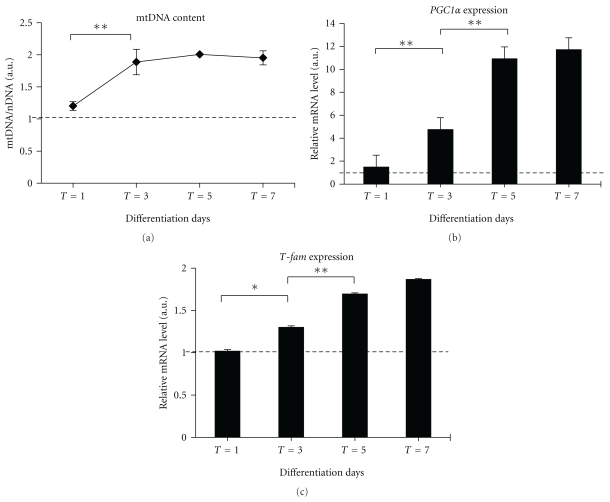
Figure 3.
Evaluation of mitochondrial biogenesis during myoblast differentiation. In (a), determination by real-time PCR of mtDNA content expressed as mtDNA/nDNA ratio (COXII/GAPDH), as described in Section 2. In (b), quantitative analyses of PGC-1 α and T-fam by real-time PCR. The amount of each target transcript was related to that of the reference gene (the ribosomal protein S16). Data are expressed as the mean ± SEM of three experiments; all samples were analyzed in triplicate. Results from PCR real-time analysis were compared with the ANOVA test, followed by a post hoc test using Tukey's multiple comparison test. The threshold of significance for the ANOVA and the Tukey's test was fixed at *P ≤ .05; **P ≤ .01.

