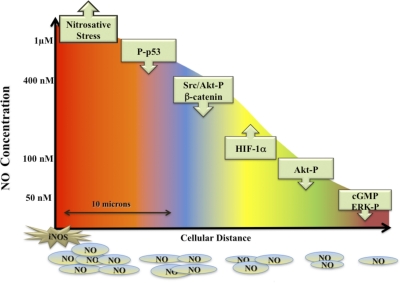
Figure 4. The effect of steady-state flux of NO on signal transduction mechanisms.
This diagram represents the level of sustained NO that is required to activate specific pathways in tumor cells. Similar effects have been seen on endothelial cells. These data were generated by treating tumor or endothelial cells with the NO donor DETANO (NOC-18) for 24 h and then measuring the appropriate outcome measures (for example, p53 activation). Various concentrations of DETANO that correspond to cellular levels of NO are: 40–60 μM DETANO = 50 nM NO; 80–120 μM DETANO = 100 nM NO; 500 μM DETANO = 400 nM NO; and 1 mM DETANO = 1 μM NO. The diagram represents the effect of diffusion of NO with distance from the point source (an activated murine macrophage producing iNOS) in vitro (Petri dish) generating 1 μM NO or more. Thus, reactants or cells located at a specific distance from the point source (i.e., iNOS, represented by star) would be exposed to a level of NO that governs a specific subset of physiological or pathophysiological reactions. The x-axis represents the different zone of NO-mediated events that is experienced at a specific distance from a source iNOS producing >1 μM. Note: Akt activation is regulated by NO at two different sites and by two different concentration levels of NO.

