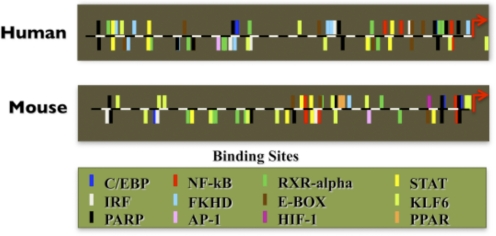
Figure 5. Comparison of the promoter region of NOS2 between human and murine.
Promoters′ information was obtained from the Genomatix Software Suite. Each bar represents a particular transcription factor binding site. Upward bars represent the bind site located on the sense strand of the DNA, and downward bars represent the binding sites located on the nonsense strand. IRF, IFN regulatory factor; PARP, poly(ADP-ribose) polymerase; RXR-α, retinoid X receptor α; E-BOX, E-box binding factors, contains binding domains bHLH-ZIP and bZIP; KLF6, Kruppel-like factor 6.

