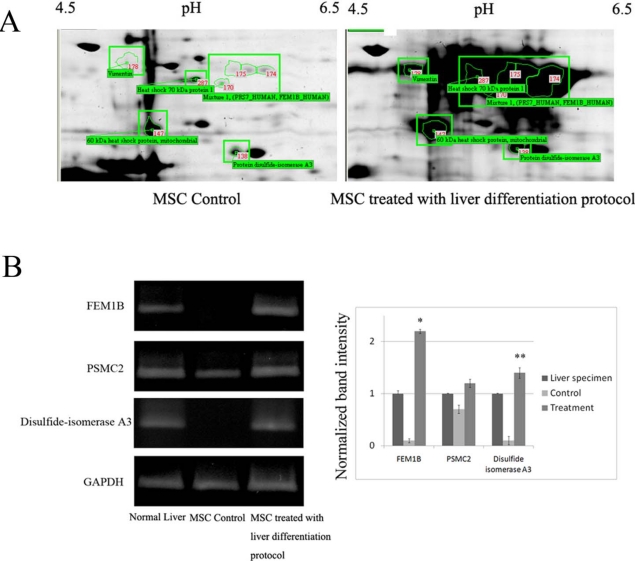
Figure 4.
(A) Proteome map of protein extraction from MSC control and treatment. Identification of proteins were performed by 2D gel electrophoresis follow by MALDI-TOF-MS. Isoelectric focusing were performed with 50 μg total proteins from MSC using 3–10 pH-strips, 18 cm. SDS-PAGE were performed on 12.5% gels and stained with Coomassie blue G-250; (B) Total RNA was isolated from MSCs cells treated with or without liver differentiation protocol and liver specimens. Expression of FEM1B, PSMC2 and disulfide-isomerase A3 mRNA levels was evaluated using RT-PCR. The results, based on the ratio of these mRNA amplification to that of GAPDH, are presented as the fold increase relative to the mRNA levels from liver specimens. The results are expressed as the mean ± SD of three separate experiments (* p < 0.001, ** p = 0.01 versus the control MSC).

