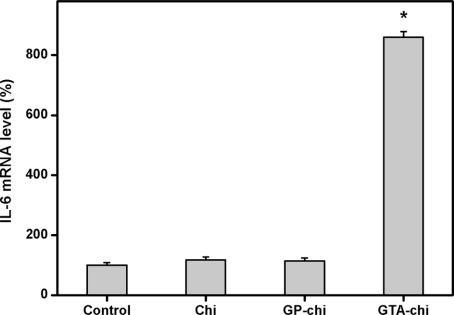
Figure 6.
Gene expression of IL-6 in ARPE-19 cells incubated with various chitosan membranes (5 mg) for 3 days, measured by real-time RT-PCR. Normalization was done using GAPDH. Data in the experimental groups are percentages relative to that of control groups (without materials). An asterisk indicates statistically significant differences (*p < 0.05; n = 3) as compared to controls.

