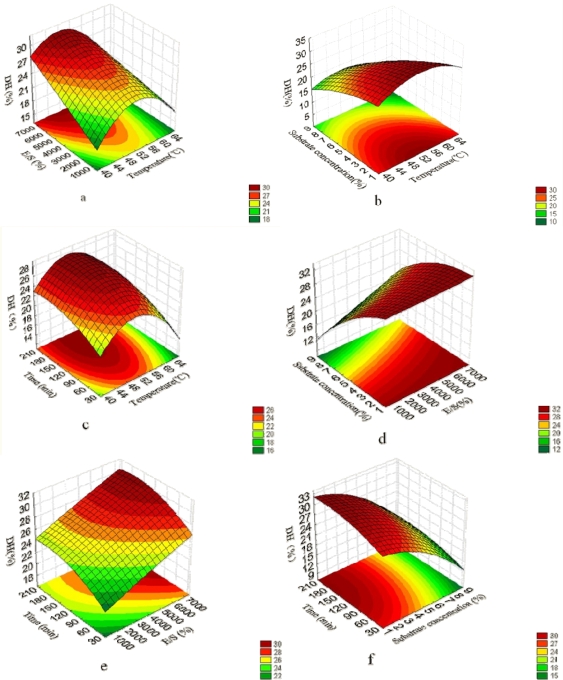
Figure 1.
Response surfaces for the interaction of variables on DH. The response surface plots at various (a) temperatures and E/S; (b) temperatures and substrate concentrations; (c) temperatures and reaction times; (d) E/S and substrate concentrations; (e) E/S and reaction times; and (f) substrate concentrations and reaction times.

