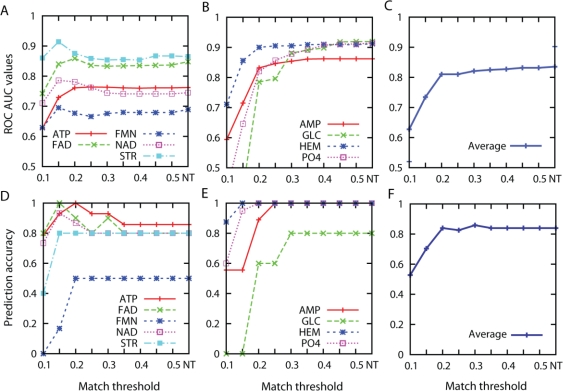
Figure 4.
Prediction performance using shape and pocket size information. ROC AUC values of pockets that bind to (A) ATP, FAD, FMN, NAD, and STR; (B) AMP, GLC, HEM, and PO4. (C) Average ROC AUC values over all ligand types. Top-3 prediction success rate of (D) ATP, FAD, FMN, NAD, and STR; (E) AMP, GLC, HEM, and PO4. (F) Average Top-3 success rate over all ligand types. *NT in x-axis denotes experiments with no threshold used.

