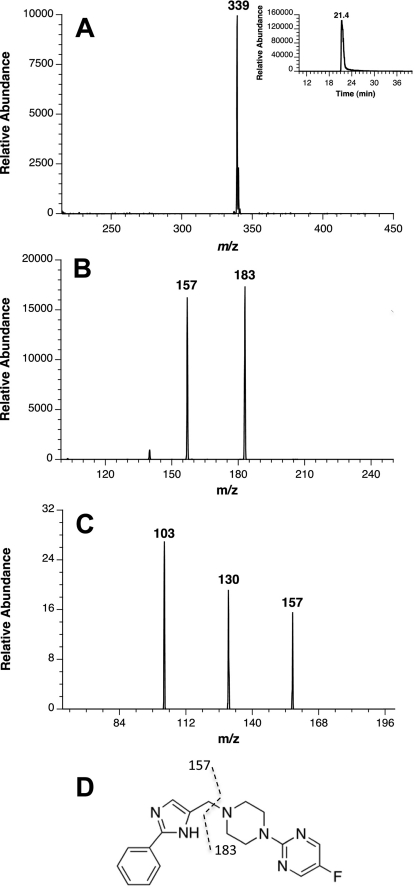
Fig. 8.
Mass spectral analysis of SCH 66712. A, mass spectrum of the molecular ion eluting at 21 min and extracted ion chromatogram of the molecular [M + H]+ ion with m/z of 339 (inset). B, tandem mass spectrometry of SCH 66712. C, MS3 of the m/z 157 ion from B. D, MS2 fragmentation pattern of SCH 66712.

