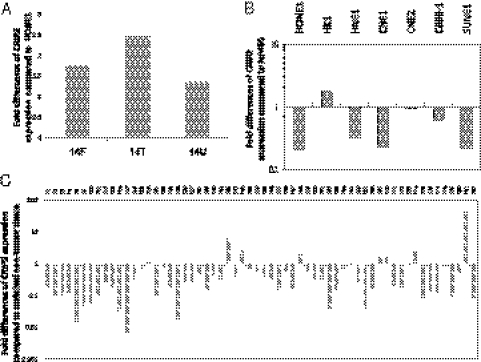
Fig. 1.
CRIP2 gene expression analysis. (A) qPCR analysis of CRIP2 expression in three chromosome 14 MCHs. The expression fold changes were compared with the recipient HONE1 cell line. (B) qPCR analysis of CRIP2 expression in seven NPC cell lines. The expression fold changes of the NPC cell lines were compared with that of the immortalized nontumorigenic cell line NP460. (C) qPCR analysis of CRIP2 expression in 60 NPC paired biopsy specimens. The fold changes of the NPC tumor tissues were compared with their corresponding nontumor tissues.

