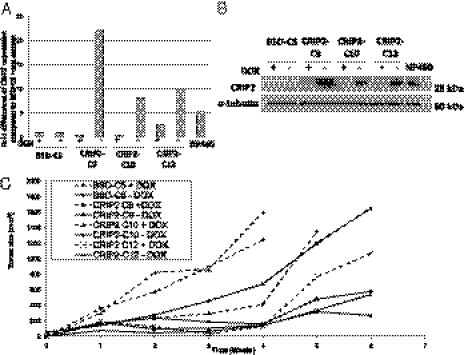
Fig. 2.
CRIP2 expression levels in the CRIP2-expressing clones in an in vivo tumorigenicity assay. (A) qPCR analysis of CRIP2 expression in the vector-alone BSD-C5 (±dox) and the three CRIP2-expressing clones CRIP2-C9, -C10, and -C12 (±dox). The expression levels were compared with that of BSD-C5 (+dox). The NP460 cell line was used as a control for endogenous CRIP2 expression. (B) Western blot analysis of BSD-C5 and CRIP2-C9, -C10, and -C12 (±dox). α-tubulin served as a loading control. (C) In vivo tumorigenicity assay of CRIP2-expressing clones and vector-alone controls (+dox). The curves represent an average tumor volume of all sites inoculated for each cell population. Vector-alone BSD-C5 (±dox) formed large tumors by 6 wk postinjection. Small tumors were induced after 5–6 wk postinjection in all of the CRIP2-expressing clones. Tumorigenicity was restored when CRIP2 gene expression was switched off (+dox).

