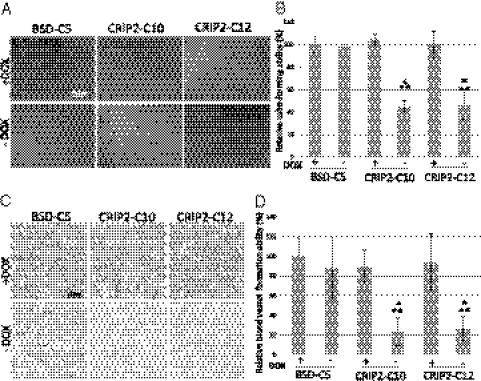
Fig. 3.
In vitro and in vivo angiogenesis assays of CRIP2-expressing clones. (A) Representative images of the HUVEC tube formation assay of vector-alone (BSD-C5) and CRIP2-expressing clones. (B) Summary of the relative tube-forming ability of the vector-alone (BSD-C5) and CRIP2-expressing clones (±dox). Relative tube-forming ability was calculated by comparing the total tube length of each sample to that of BSD-C5 (+dox). (C) Representative images of the in vivo Matrigel plug CD34 IHC staining of vector-alone (BSD-C5) and CRIP2-expressing clones. The brown color represents positive staining of the blood vessels. (D) Summary of the relative blood vessel formation ability of vector-alone (BSD-C5) and CRIP2-expressing clones (±dox). Relative blood vessel formation ability was calculated by comparing the total tube length of each sample with that of the BSD-C5 (+dox) control. *P < 0.05 and **P < 0.05, statistically significant differences compared with the vector-alone control and corresponding +dox control, respectively.

