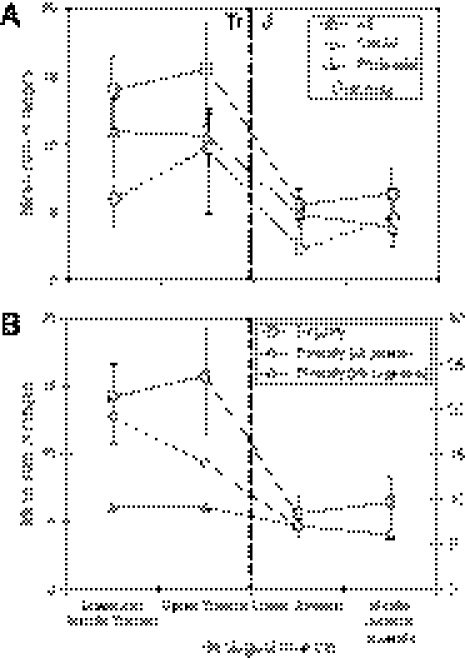
Fig. 3.
Disparity and diversity of ichthyosaurs through the Triassic and Jurassic. The global disparity values are based on the sum-of-ranges metric, and diversity is the number of species. Error bars are 95% confidence intervals. (A) Disparity change is shown for all characters, cranial characters, and postcranial characters. (B) All-character disparity compared with genus-level diversity change, showing plots for study genera (those included in the disparity study) and for all genera (addition of incompletely known taxa that were excluded from the disparity study but are close relatives of included taxa). The Tr-J boundary is marked by a heavy dashed vertical line.

