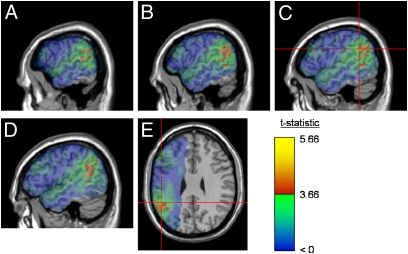
Fig. 2.
Maps of the reliability (t statistic) of the difference in ResidTheme between patients with and without lesions in each voxel. Voxels exceeding the false discovery rate threshold (q = 0.02) are rendered in a red (t = 3.66) to yellow (t = 5.66) scale; green and blue are rendered as described in Fig. 1. Statistical maps are superimposed on the MNI (Montreal Neurological Institute) space Colin27 template. In all panels, a large cluster of significant voxels is visible in the temporoparietal junction. A–D show sagittal slices at x = −60, x = −56, x = −52, and x = −48, respectively. The region of peak effect is marked with crosshairs. E shows an axial slice at z = 28, selected to intersect the peak region.

