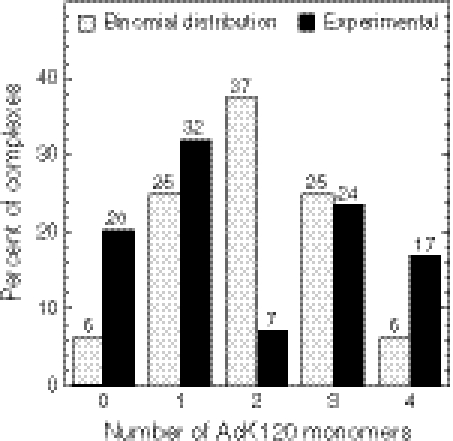
Fig. 5.
Distribution of AcK120DBD and nonacetylated DBD in tetrameric complex with DNA. Equal amounts of 13C-15N-nonacetylated DBD and AcK120DBD were mixed with DNA at molar ratios of 8∶8∶1 and samples were analyzed by ESI-MS. Results are presented as function of number of AcK120DBDs in each complex: 0—a homotetramer composed of four nonacetylated DBDs; 4—a homotetramer composed of four AcK120DBDs. Bars represent the distribution of complexes relative to the total amount of formed complexes. For example, 17% of the complexes were in the form of DNA(AcK120DBD)4 complex, whereas 7% were in the form of DNA(AcK120DBD)2(p53DBD)2 complex. Experimental data are compared to results expected in a nonbiased experiment, assuming binomial distribution.

