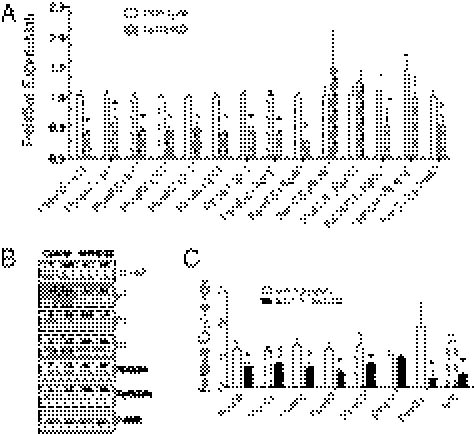
Fig. 6.
Nrf1 deficiency in mouse brains leads to coordinate down-regulation of proteasome genes. (A) Comparison of proteasome gene expression by quantitative RT-PCR analysis. Mean values ± SEM (n = 3 for each genotype). *P < 0.05. (B) Levels of proteasome subunits analyzed by Western blotting. Densitometric quantitations of band intensities are shown. (C) Quantitative RT-PCR analysis of mRNA encoding proteasomal genes in Nrf1+/+/Cre-ERT2 and Nrf1flox/flox/Cre-ERT2 neuronal cultures after tamoxifen treatment. Results are means ± SEM, n = 4 for each group. *P < 0.05.

