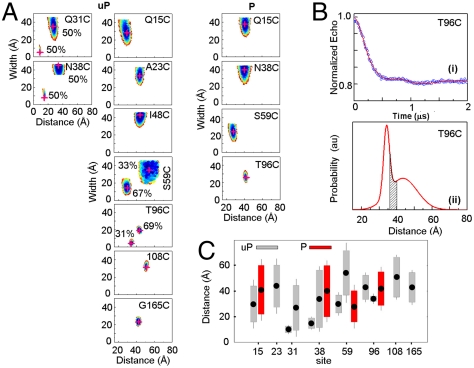
Fig. 2.
EPR data for SMM monomers. (A) Contour plots of average distance and distance distribution width for uP (Left) and P (Right) SMM monomers in 0.5 M KCl, 0.1 mM EGTA, 10 mM 3-(N-morpholino)propanesulfonic acid (MOPS), pH 7.5. The contours depict associated χ2 error surface, the goodness of fit as a function of the fitting parameters [color coded from blue ( ) to red (
 )] to denote 67% confidence limit. Best fit position is highlighted by a red “+.” For sites 31, 38, 59, and 96 two Gaussian populations are plotted separately, fractional contributions are indicated. (B) DEER signal time evolution of the echo (Upper, circles), best fits (Upper, solid line) corresponding to the Gaussian distance distribution in the Lower panel for site 96. Gray area is the range of interspin distances predicted by MMCM. (C) Summary of phosphorylation effects on distances and distance distributions. Filled points show the average distance, rave. Lengths of open and hashed bars represent the y-axis value of the magenta cross in (B) for uP and P myosin, respectively. The error on the distances is represented by the visible length of whiskers attached to the bars. For sites 31, 38, 59, and 96 the two Gaussian populations are plotted separately.

