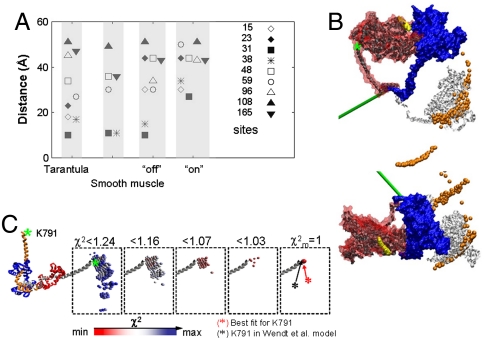
Fig. 4.
Modeling results. (A) Comparison of RLC–RLC distances. Distances measured by EPR in the monomers were attributed to off and on states. RLC–RLC distances shown are for the off and on models derived from rigid body docking. The corresponding distances from smooth muscle [Wendt et al., (9)] and tarantula [Alamo et al., (6)] off-state models are shown. Note that for some sites there is little difference between off and on states. (B) (Enlargement of Fig. 4B appears in Fig. S5.) Comparison of modeled structures using EPR constraints versus EM model from Wendt et al. (9). Free head of Wendt model (9) is blue and blocked head is red. Light chains have been omitted for clarity. The dark gray and white ribbons depict our attributed off- and on-state blocked head positions, respectively, both at  . Note the close similarity of our off-state with the EM model. The ribbons show the MD in the original Wendt “bent” configuration for clarity, but our data do not stipulate this. Our data stipulate the position of the lever arm only. The on model is generated by a complex rotation and a twist that can be approximated by 110° rotation about the axis depicted in green. The yellow and orange balls show the positions of the top of the MD (residue 560) for all solutions for which
  for the off and on models respectively, again assuming that the MD adopts the blocked conformation. Green asterisk shows position of K791 of HC. The model on the top was rotated by 90° to generate orthogonal view of the model, bottom. (C) The relationship between the χ2 threshold (red minimum and blue maximum) for the position of K791 at the N-terminus of HC lever arm helix in off-state EPR model (colored balls) for the blocked head helix (gray) and its RLC (red) relative to a fixed free head (orange, HC; blue, RLC) of Wendt model.

